2020 Presidential Elections Analysis
Tahmid Ahmed
10/18 - The Effect of Demographic Changes on Elections
Overview
Different political parties typically have different voter demographics. For example, minorities are more likely to vote democrat while white people are more likely to vote republican. Moreover, demographics can also be mobilized during election cycles. For example, in light of the BLM movement, it is possible that black voters are more likely to mobilize and vote for a democratic candidate. In this project, we will look at how surges in certain demographic blocs will affect democratic vote share. From a recent study from Pew, it seems that changes in demographic blocs of african americans, females, and young voters tend to have a signficant impact on democratic popular vote share. Thus, we will pay close attention to the changes in these particular demographic blocs.
Historical demographic change effects
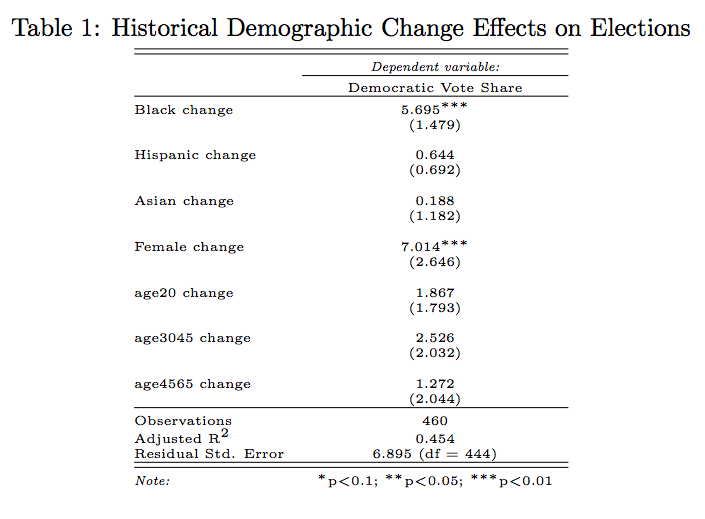
According to Table 1, we can see historically how changes in demographic blocs affect popular vote share for democrats under a linear model. It appears that the black and female vote play a significant impact on democratic vote share. For example, an increase in one percent of african americans voting increases democratic popular vote share by around 5.7%. Likewise, an increase in one percent of females voting increases democratic popular vote share by around 7%. Evidently, both changes in demographic blocs of black people and females have a p-value less than 0.01 and are significant.
Prediction model with hypothetical changes in key demographic blocs
Let’s now turn to how hypothetical changes in key demographic blocs affect election outcomes. We will thus look at how surges among particular demographic blocs impact democratic vote share in each state. We will compare predictions from these surges to predictions from historical demographic effects.
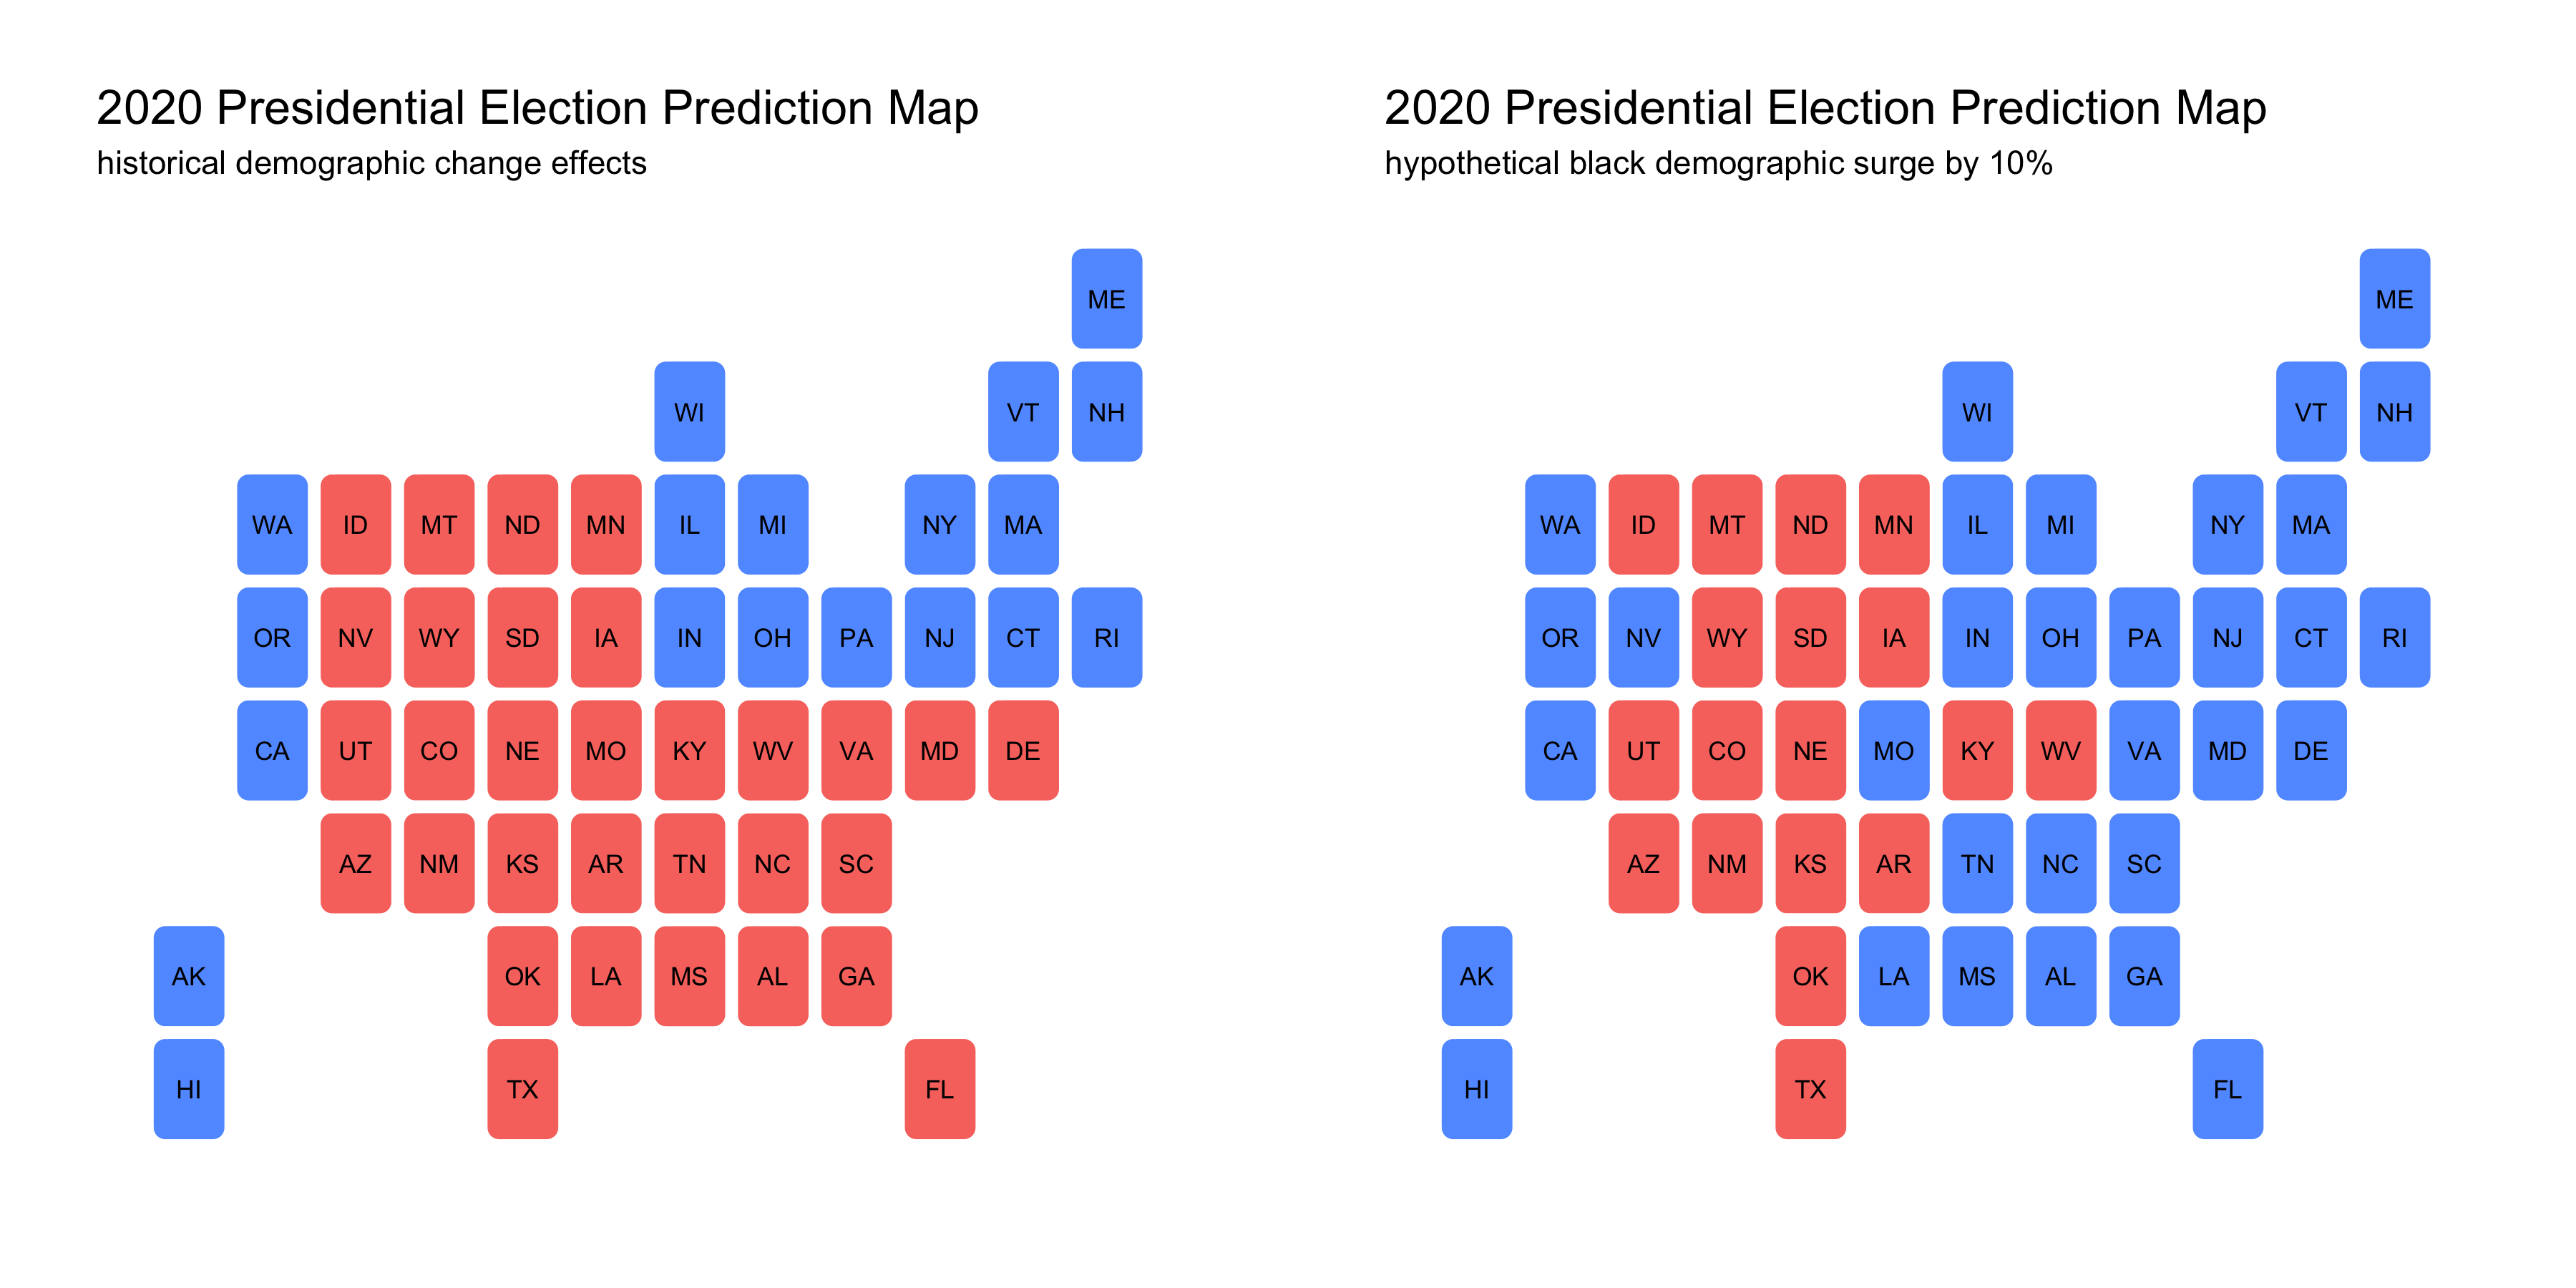
- Given the signficance of the black vote, let’s look into how a 10% surge among black voters may impact the democratic popular vote share. Considering the impact of the BLM movement and the rise of Trump’s racist rhetoric, there is a possibility that more eligible black voters will turn out to vote to see a shift in power.
- If we were to see a 10% surge in the black voting population, we would see drastic effects on democratic popular vote share. A lot of southern states would be predicted to become blue, which is something to take note of.
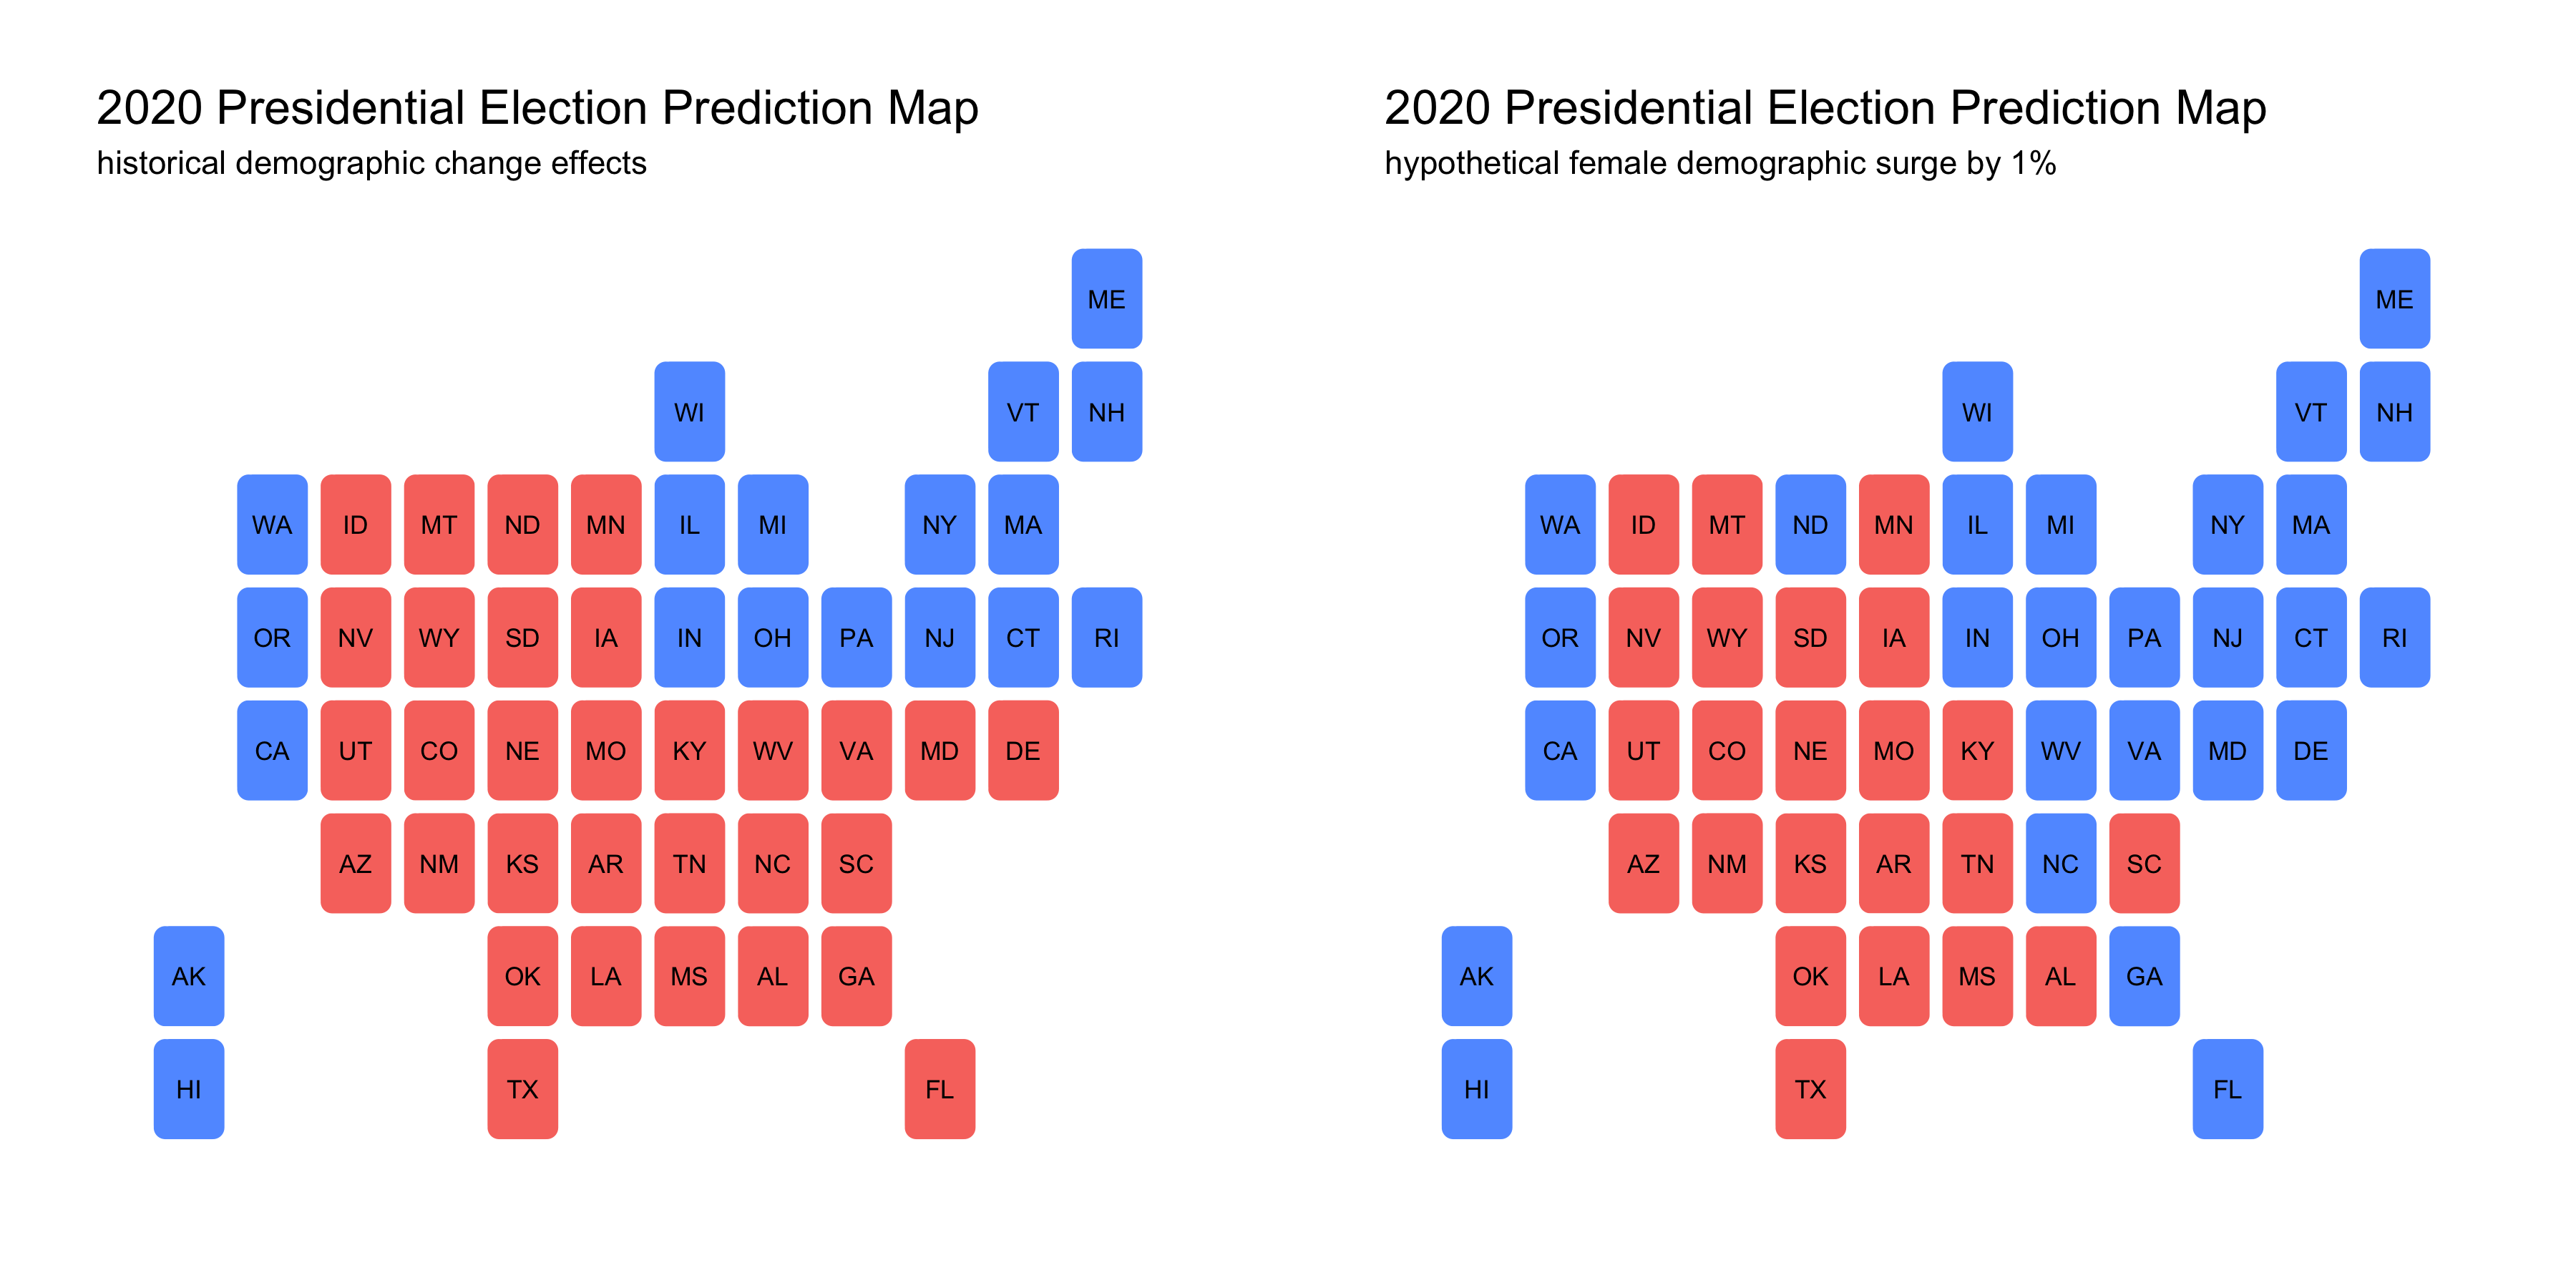
- The change in the female demographic bloc seems to have the most signficant impact on democratic vote share. This may be because females are a high proportion of the population in America. Additionally, given the fact that Biden chose a female vice president and its impact on suburban moms, it may be possible that we will also see a high voter turnout for females.
- A 1% surge in female voters also has a signficant impact on democratic vote share. I did not choose to use a 10% hypothetical surge as this would likely mean nearly all states would be blue, which would not really tell much information about how a surge in female voters will impact the election. Nonetheless, a 1% surge seemed to also have a significant impact although not as many southern states have shifted to blue.
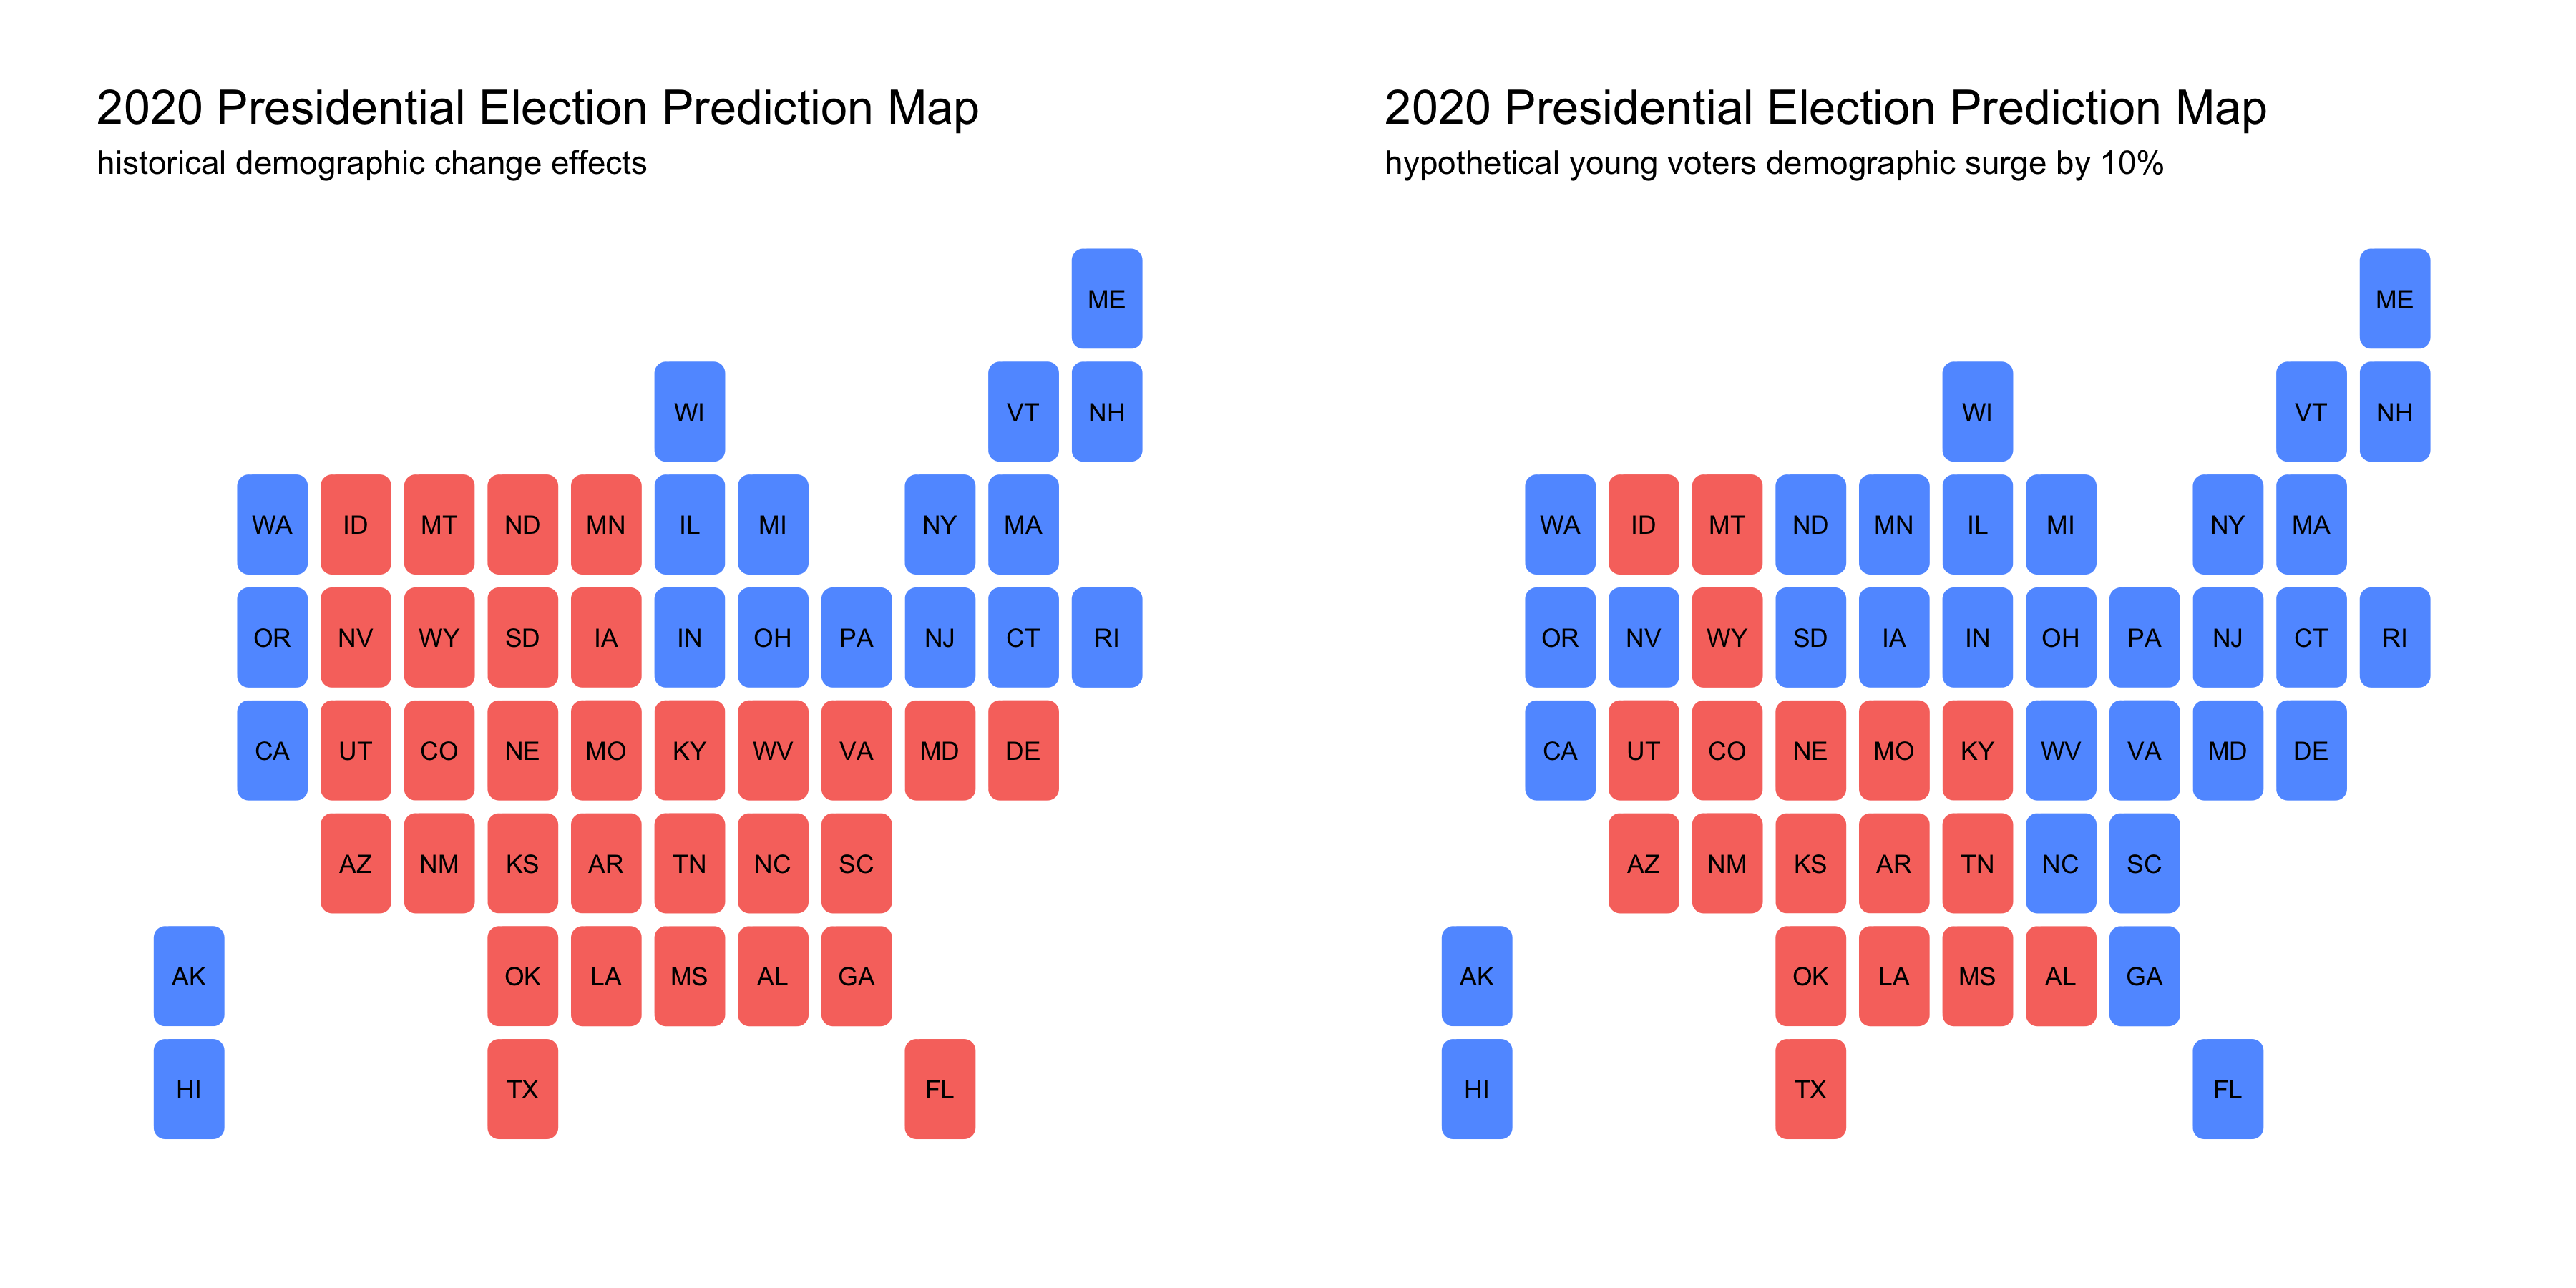
- The last plot we will look at is how a 10% surge in young voters will affect democratic vote share in 2020. Given the rise of the progressive movement, it is also likely that there may be an increase in voter turnout among young voters.
- A surge in young voters predicts that democrats are more likely to win states in the midwest and Great Plains regions. This is quite interesting as there are fewer southern states that turned blue when we see a surge among young voters.
Conclusion
It is interesting to note the significant impact changes in these particular demographic blocs have on democratic vote share. We see many traditionally red states that turn to blue. Additionally, there are some advantages with this demographic bloc model. Under this model, we are essentially fitting one regression across states as opposed to fitting a regression for each state. By using a pooled model as opposed to an unpooled model, we are able to capture correlation across states using the same constants and slopes from our regression. Furthermore, a pooled model relies less on data from each particular state, which helps to drive strength from states that are less data-sparse.